
Video - SCIMAP in under seven minutes
How can diffuse-pollution risk sources be mapped at the landscape scale?
The challenge
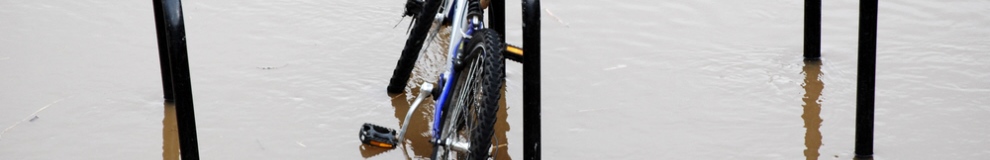
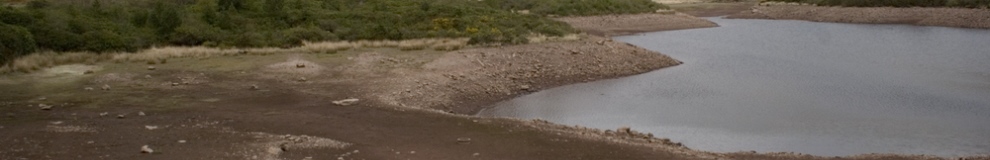
For many water quality problems, the impacts can be seen at specific points in rivers or lakes. However, if a problem results from diffuse (non-point) pollution, particularly from agricultural sources, then we need to determine where in the landscape the issue is coming from so that mitigation works can be targeted.
Traditional, physically-based modelling approaches have problems both with the large data demands necessary to represent physical processes, and with high computational costs. This makes it difficult, time consuming and expensive to apply such approaches to new locations. As a result, scientific analysis may be incomplete, or arrive too late for the decision making process.
The solution
To tackle this challenge, researchers at Durham and Lancaster Universities developed SCIMAP, a risk-based modelling framework that identifies where the possible sources of river pollution exist and prioritises high-risk areas where pollution from the landscape can enter rivers. It produces high-resolution maps (normally at a 5m grid resolution) based on both a set of risk weightings that calculate the probability that nutrients or fine sediment will leave a point in the landscape and the probability that these points will connect to the river channels.
SCIMAP can incorporate local knowledge of the landscape or scenario modelling of the areas investigated. The fine spatial scale of SCIMAP makes it possible to identify the fields and parts of fields that may be the origin of diffuse pollution problems in rivers.
SCIMAP can also be used as a management tool to test hypotheses about why plant and animal species in rivers have declined over time along by exploring which land use changes can lead to ecological risks. It can also help reveal how projections of climatic change may impact the connectivity of the landscape with rivers and lakes.
SCIMAP is available internationally and can be downloaded at: www.scimap.org.uk
Resulting benefits
SCIMAP is used by both the Environment Agency and Natural England to support environmental management. Risk maps have been developed for many Catchment Sensitive Farming and SSSI locations to guide on-the-ground investigations, and SCIMAP is available across the EA on their central modelling platform.
SCIMAP is also used by many Rivers Trusts to target mitigation works for diffuse pollution. The Eden Rivers Trust has used SCIMAP to target planting of woodlands to both reduce flood and diffuse pollution risk. The Yorkshire Dales Rivers Trust and the West Country Rivers Trust have used SCIMAP results with farmers to discuss changes in land management to improve water quality.
Future directions
Future work on SCIMAP is focusing on 1, making the approach more accessible through the use of a web-based interface and 2, by considering a wider range of risks, including flooding and FIO and the trade-offs between the different pressures.
Add Pingback